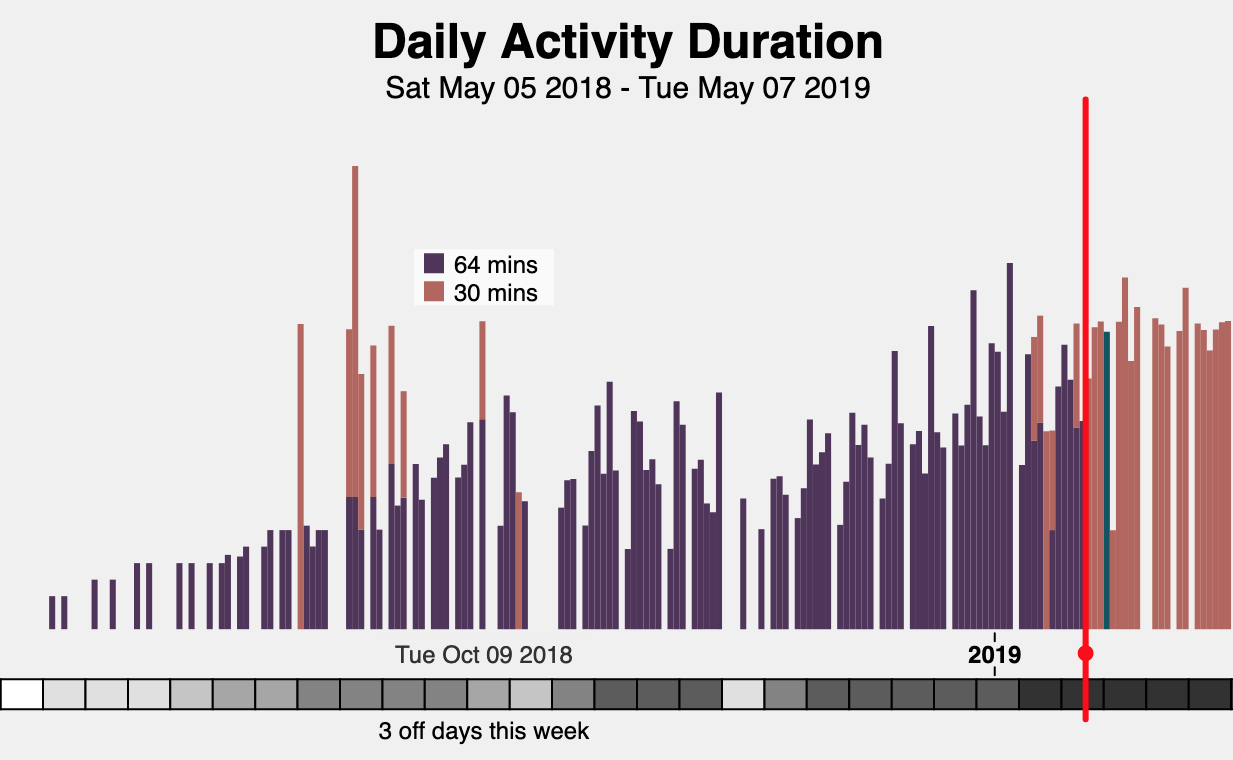
Why Am I Always Injured?
Data Vis + Design
Web app to explore my workout data and injury history. Created with p5.js.

Web app to explore my workout data and injury history. Created with p5.js.

Web-based scrolly-telling app allowing viewers to expore a more linear representation of the events of Monty Python and the Holy Grail. Created with p5.js.
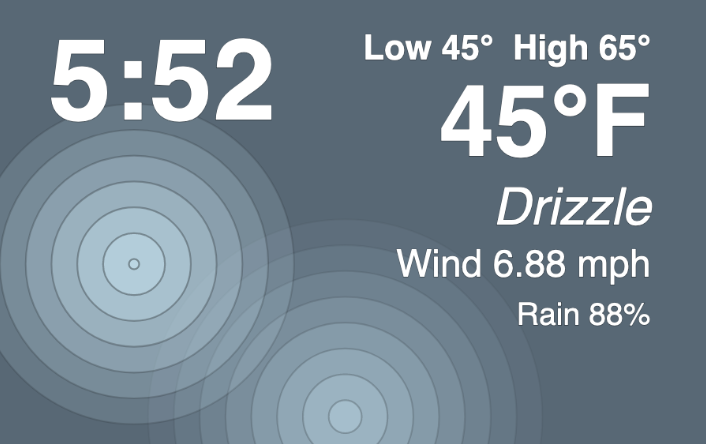
Web-based mobile weather app designed to highlight the best times of day to go running. Created with p5.js.
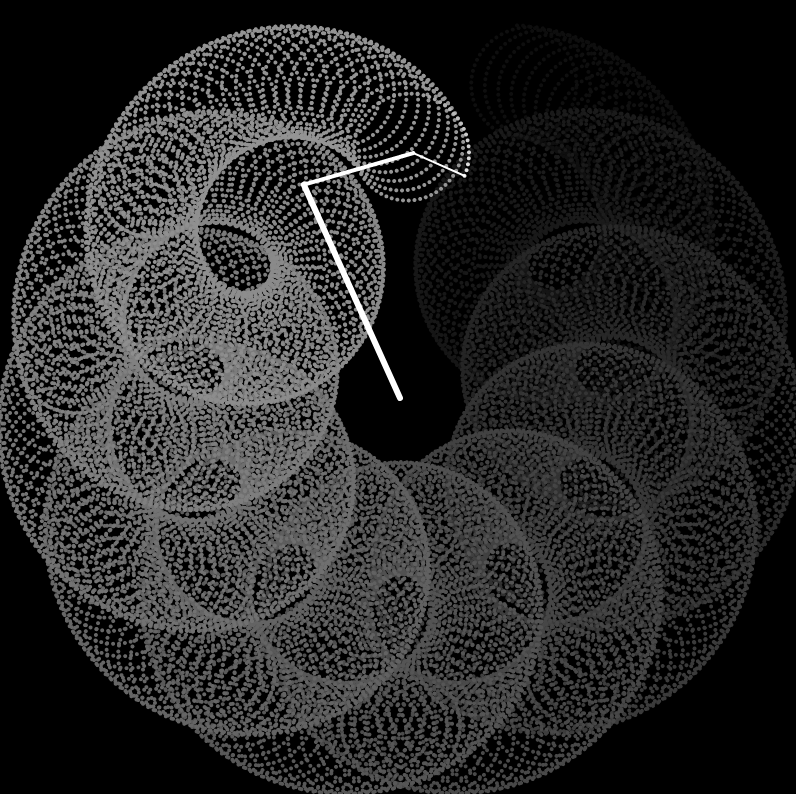
Web-based clock that gives indication of the current time with the context of passed time, created with p5.js.
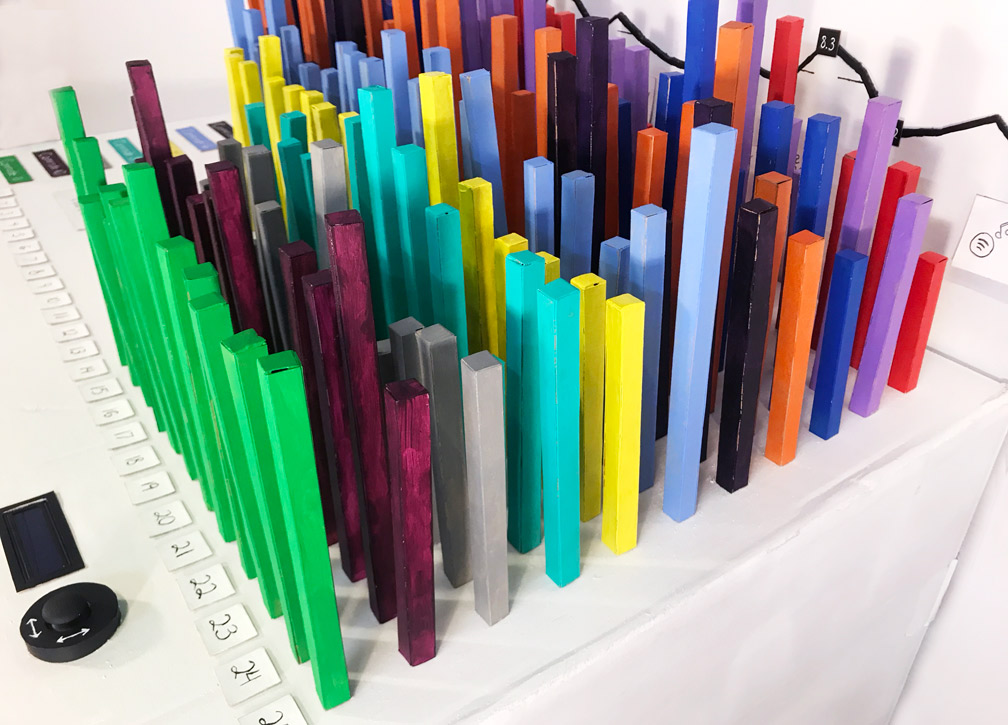
Handmade interactive data physicalization made entirely out of cardboard and cereal boxes that explores my and my peers' experience over a couple weeks in quarentine. Final project for 6.894 Interactive Data Visualizations.
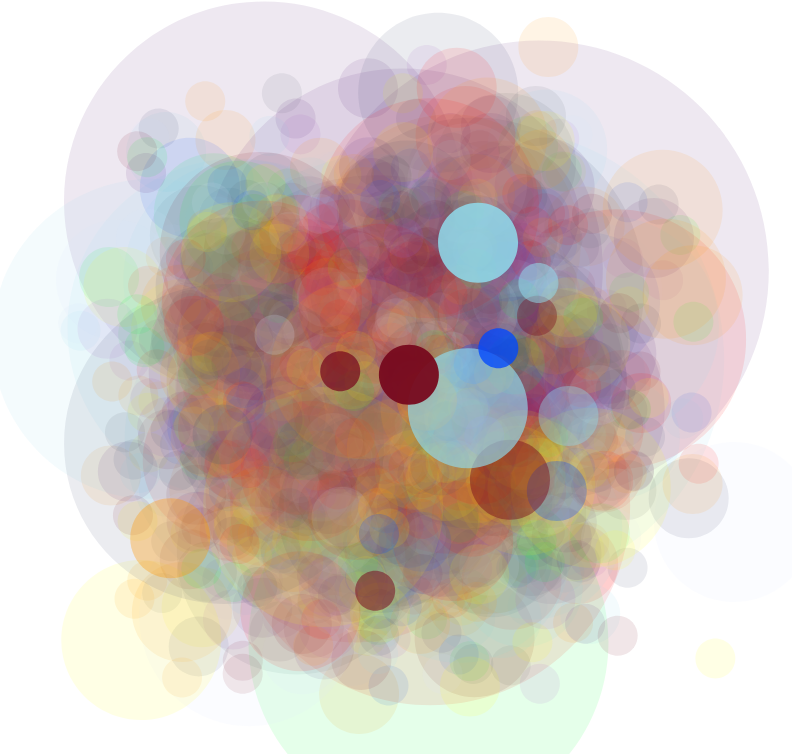
Web app amaiming to create a synesthesia-like experience by translating sound into a colorful display. Final projcect for 6.835 Intelligent Multimodal User Interfaces.
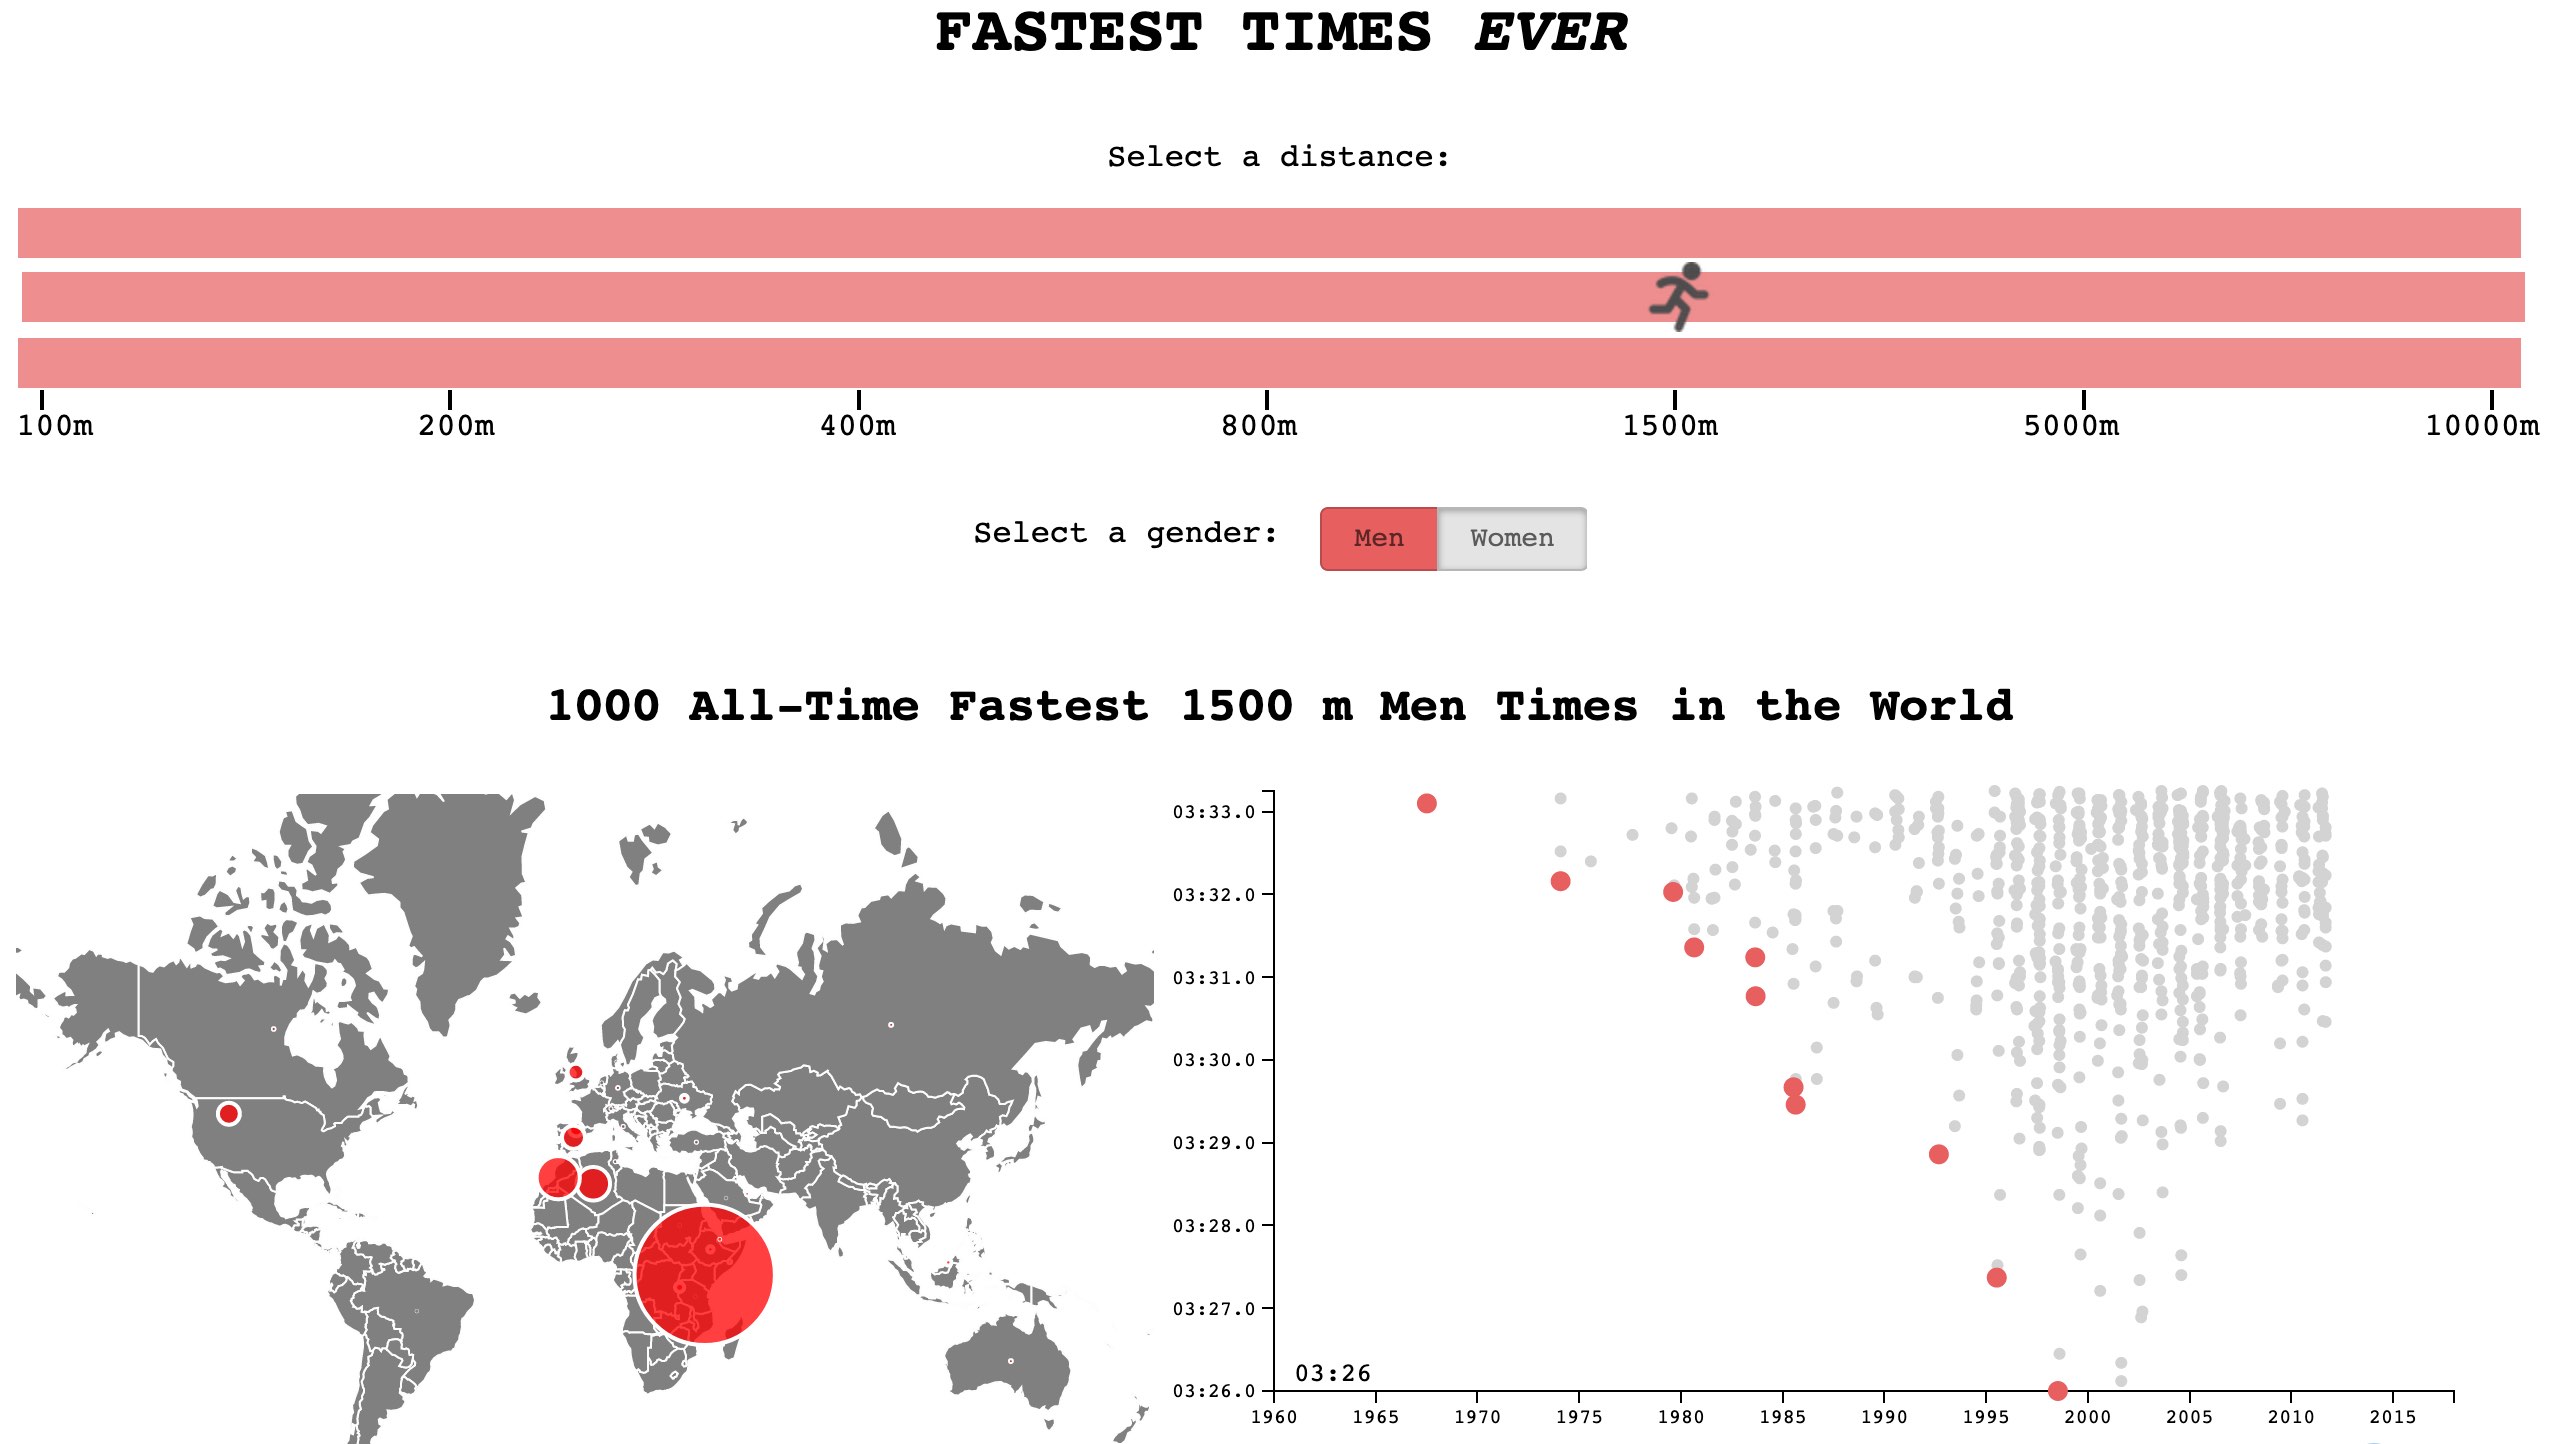
Interactive data visualization web app allowing users to expore data of the fastest running times recorded across a number of different distances. Project for 6.894 Interactive Data Visualizations.
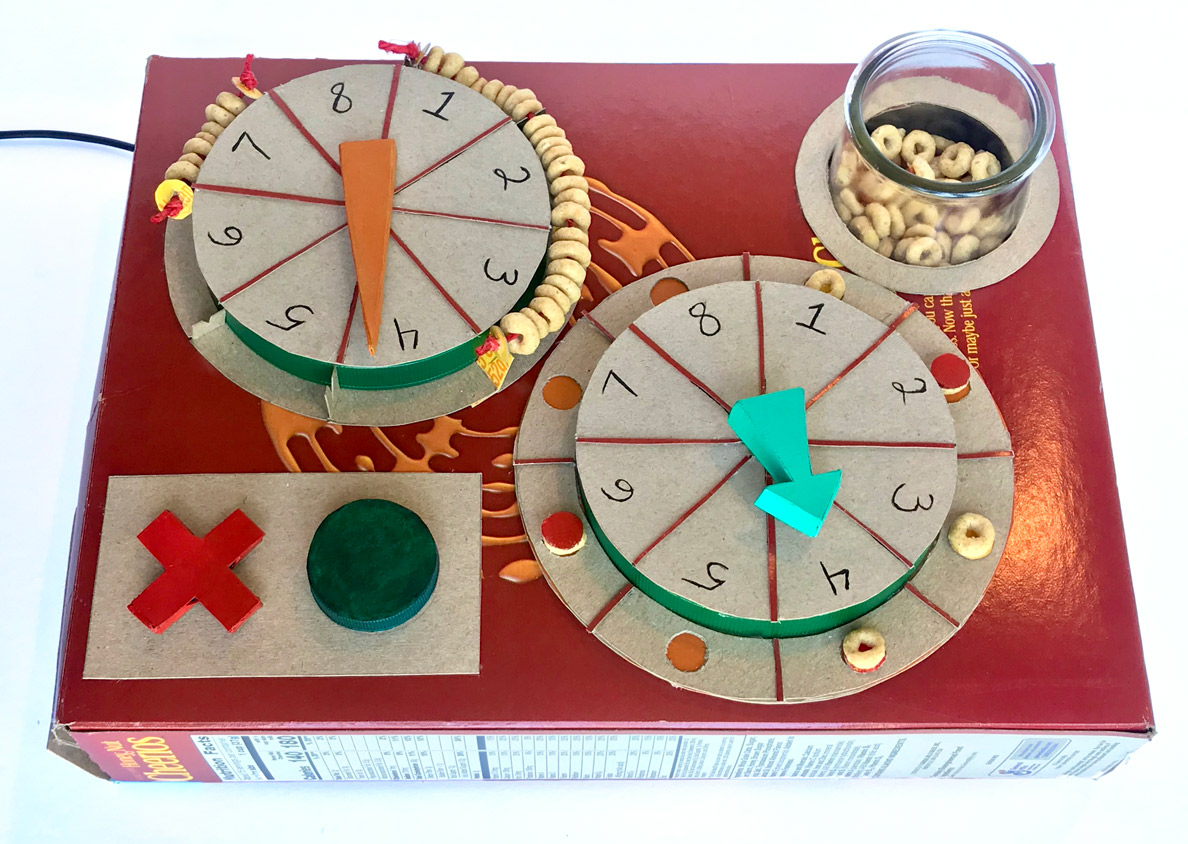
Two-person, battleship-inspired remote game designed from found materials during COVID-19 quarantine. Final project for 4.043 Advanced Interactions.
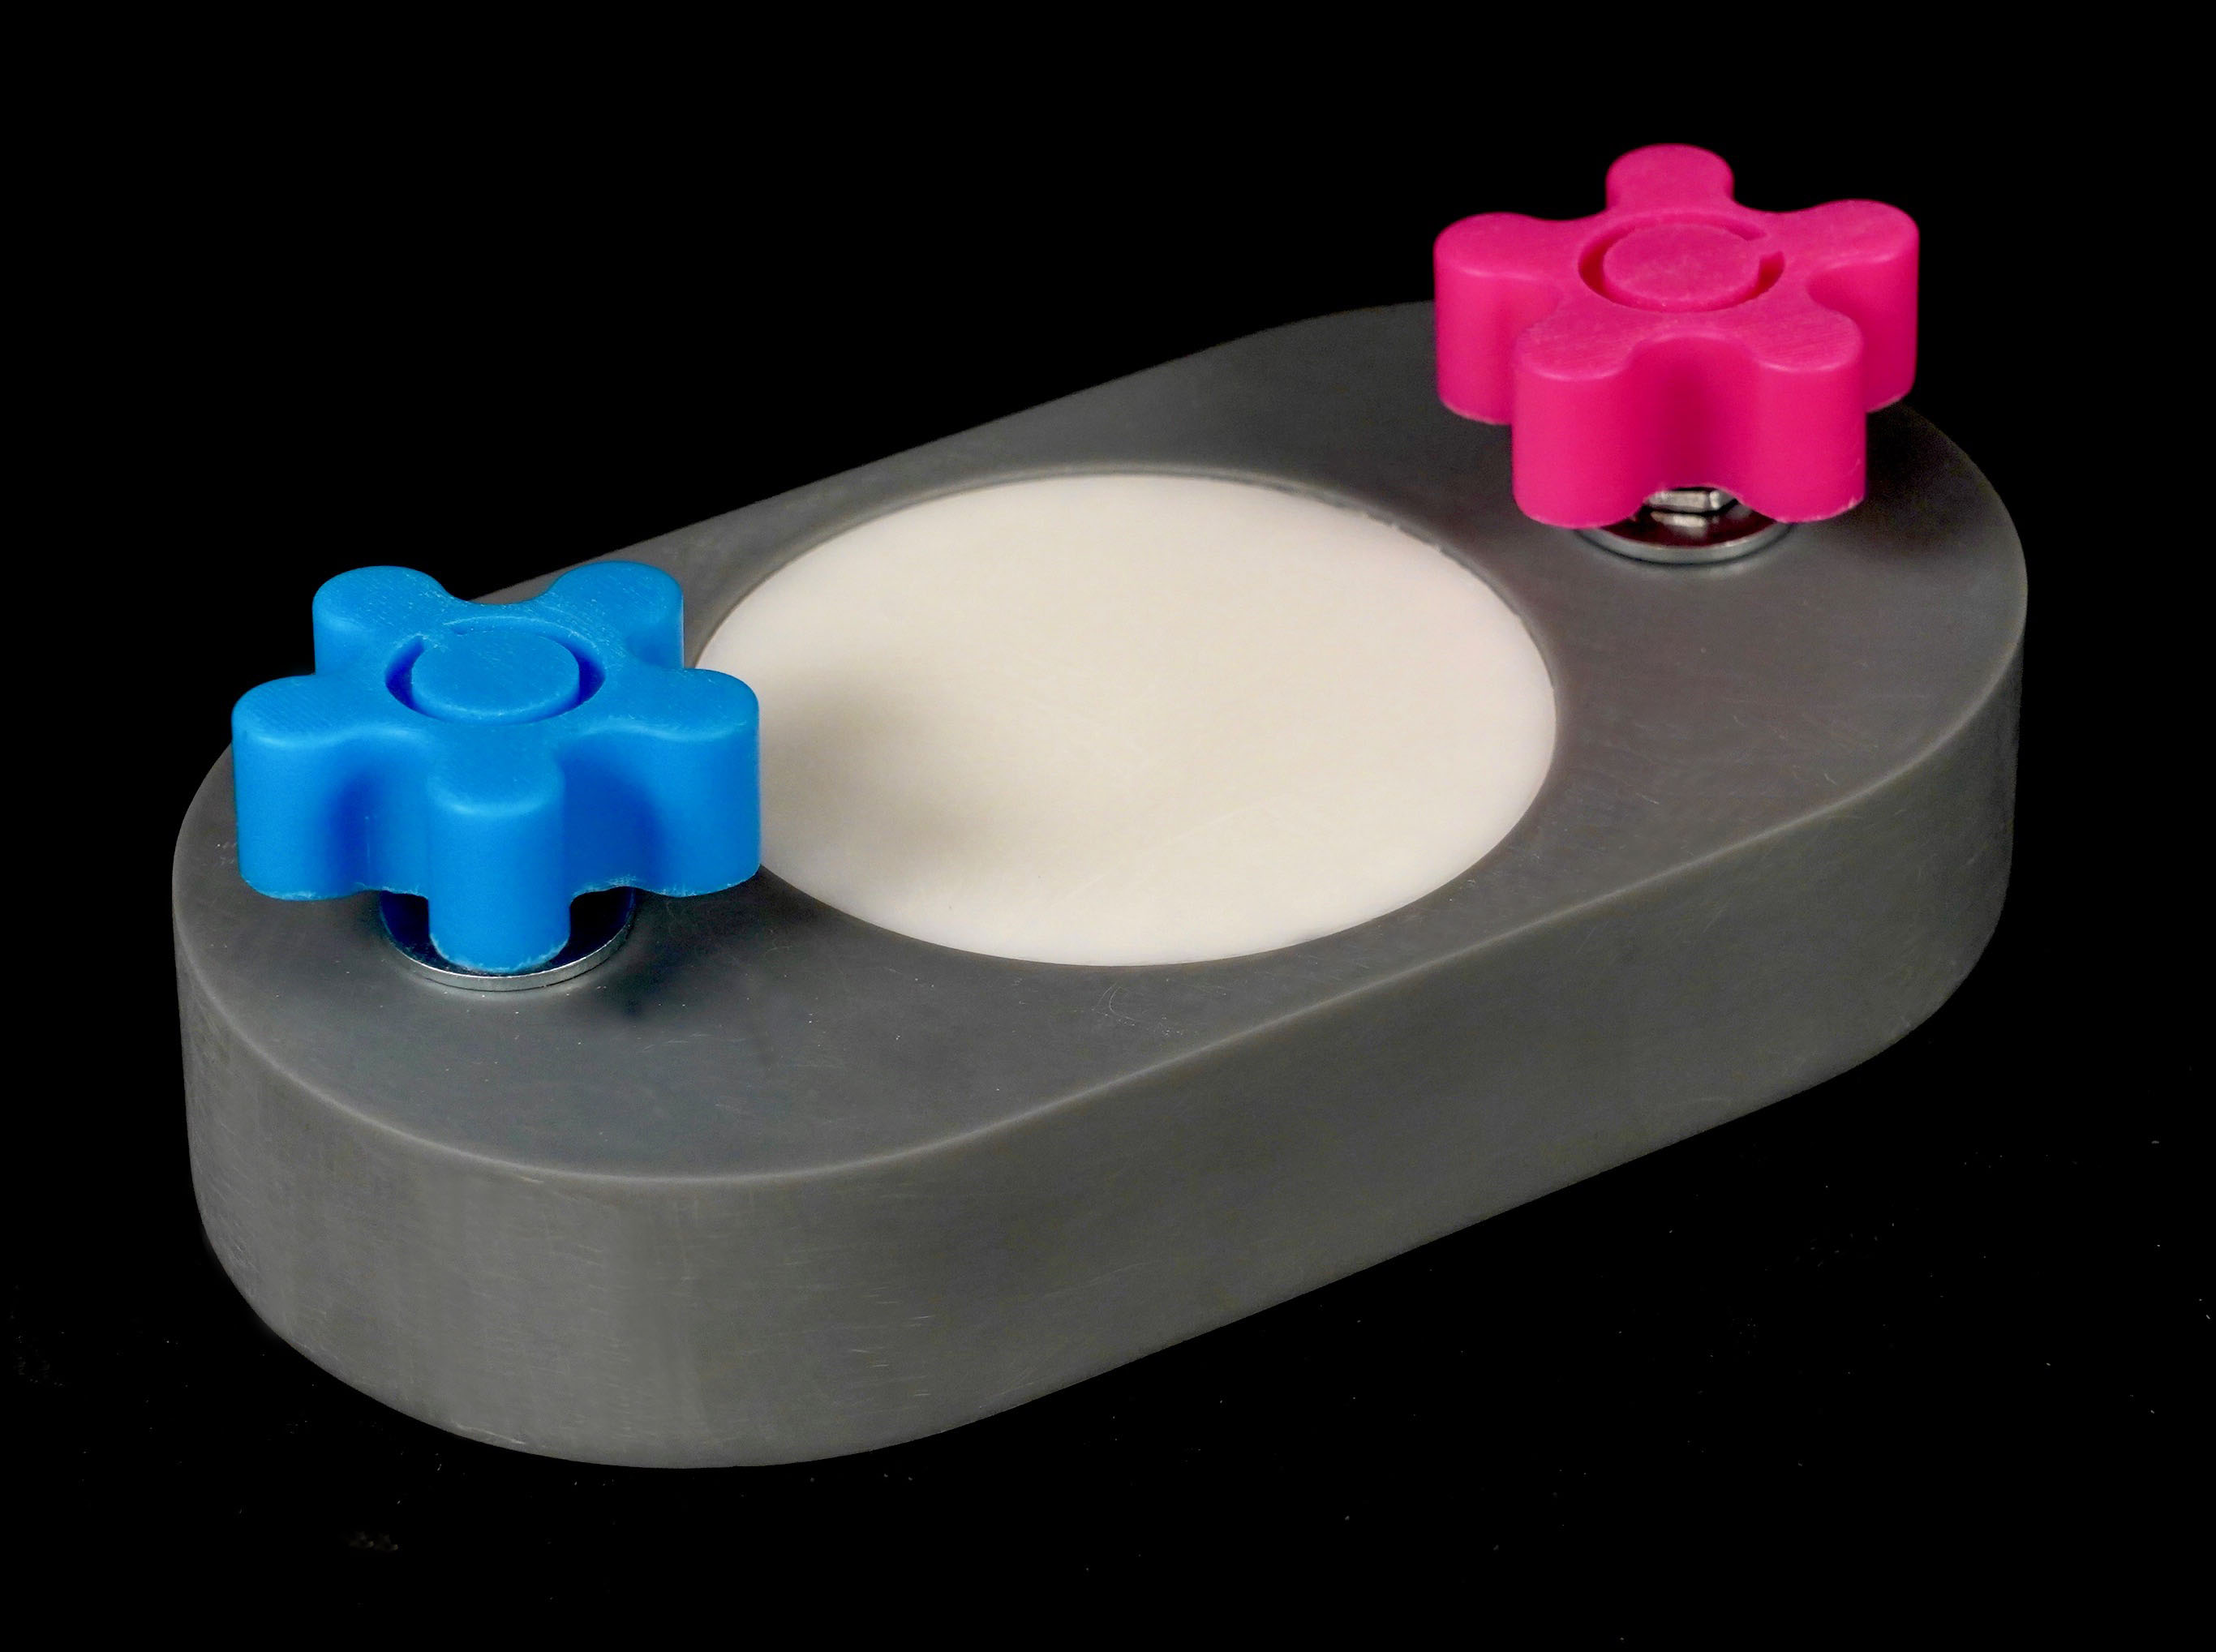
A two-person joystick game in which each player turns their joystick to move their light around the LED ring and try to capture their opponent's target. Project for 4.043 Advanced Interactions.
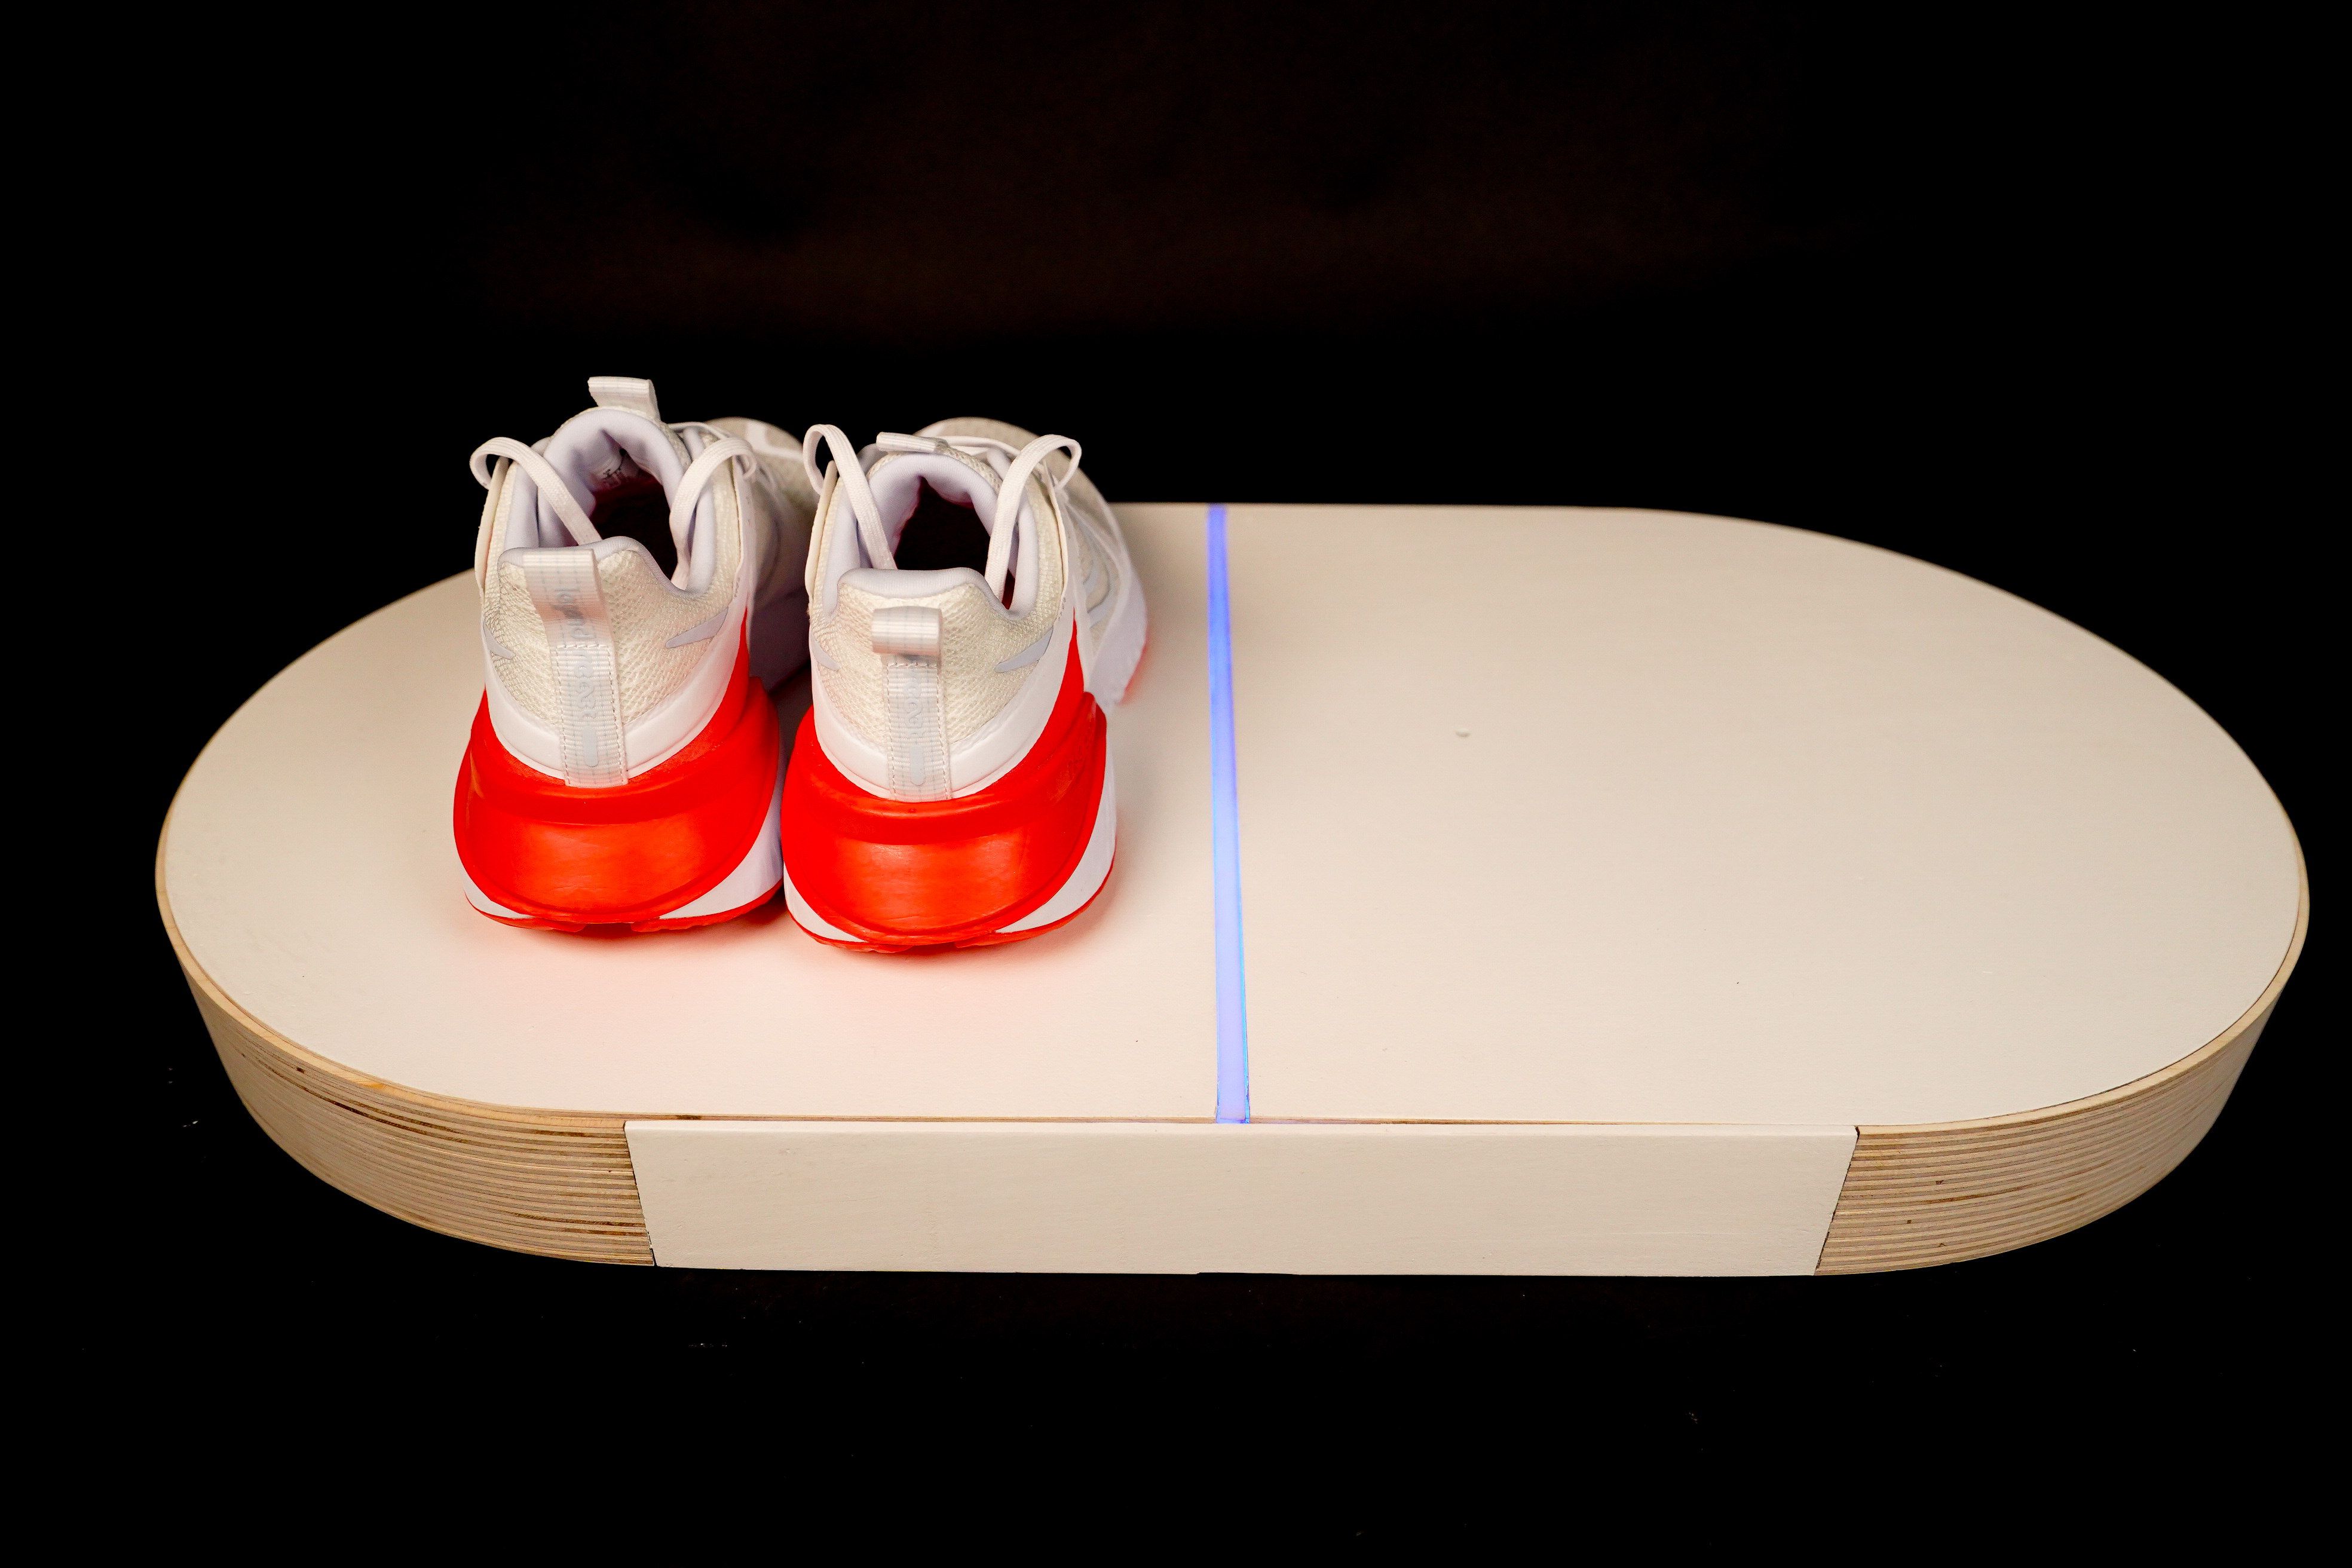
Device aiming to encourage two people to run together by tracking the amount of time their shoes are on their feet, not the platform, and comparing times with colored LEDs. Final project for 4.031 Objects and Interaction.
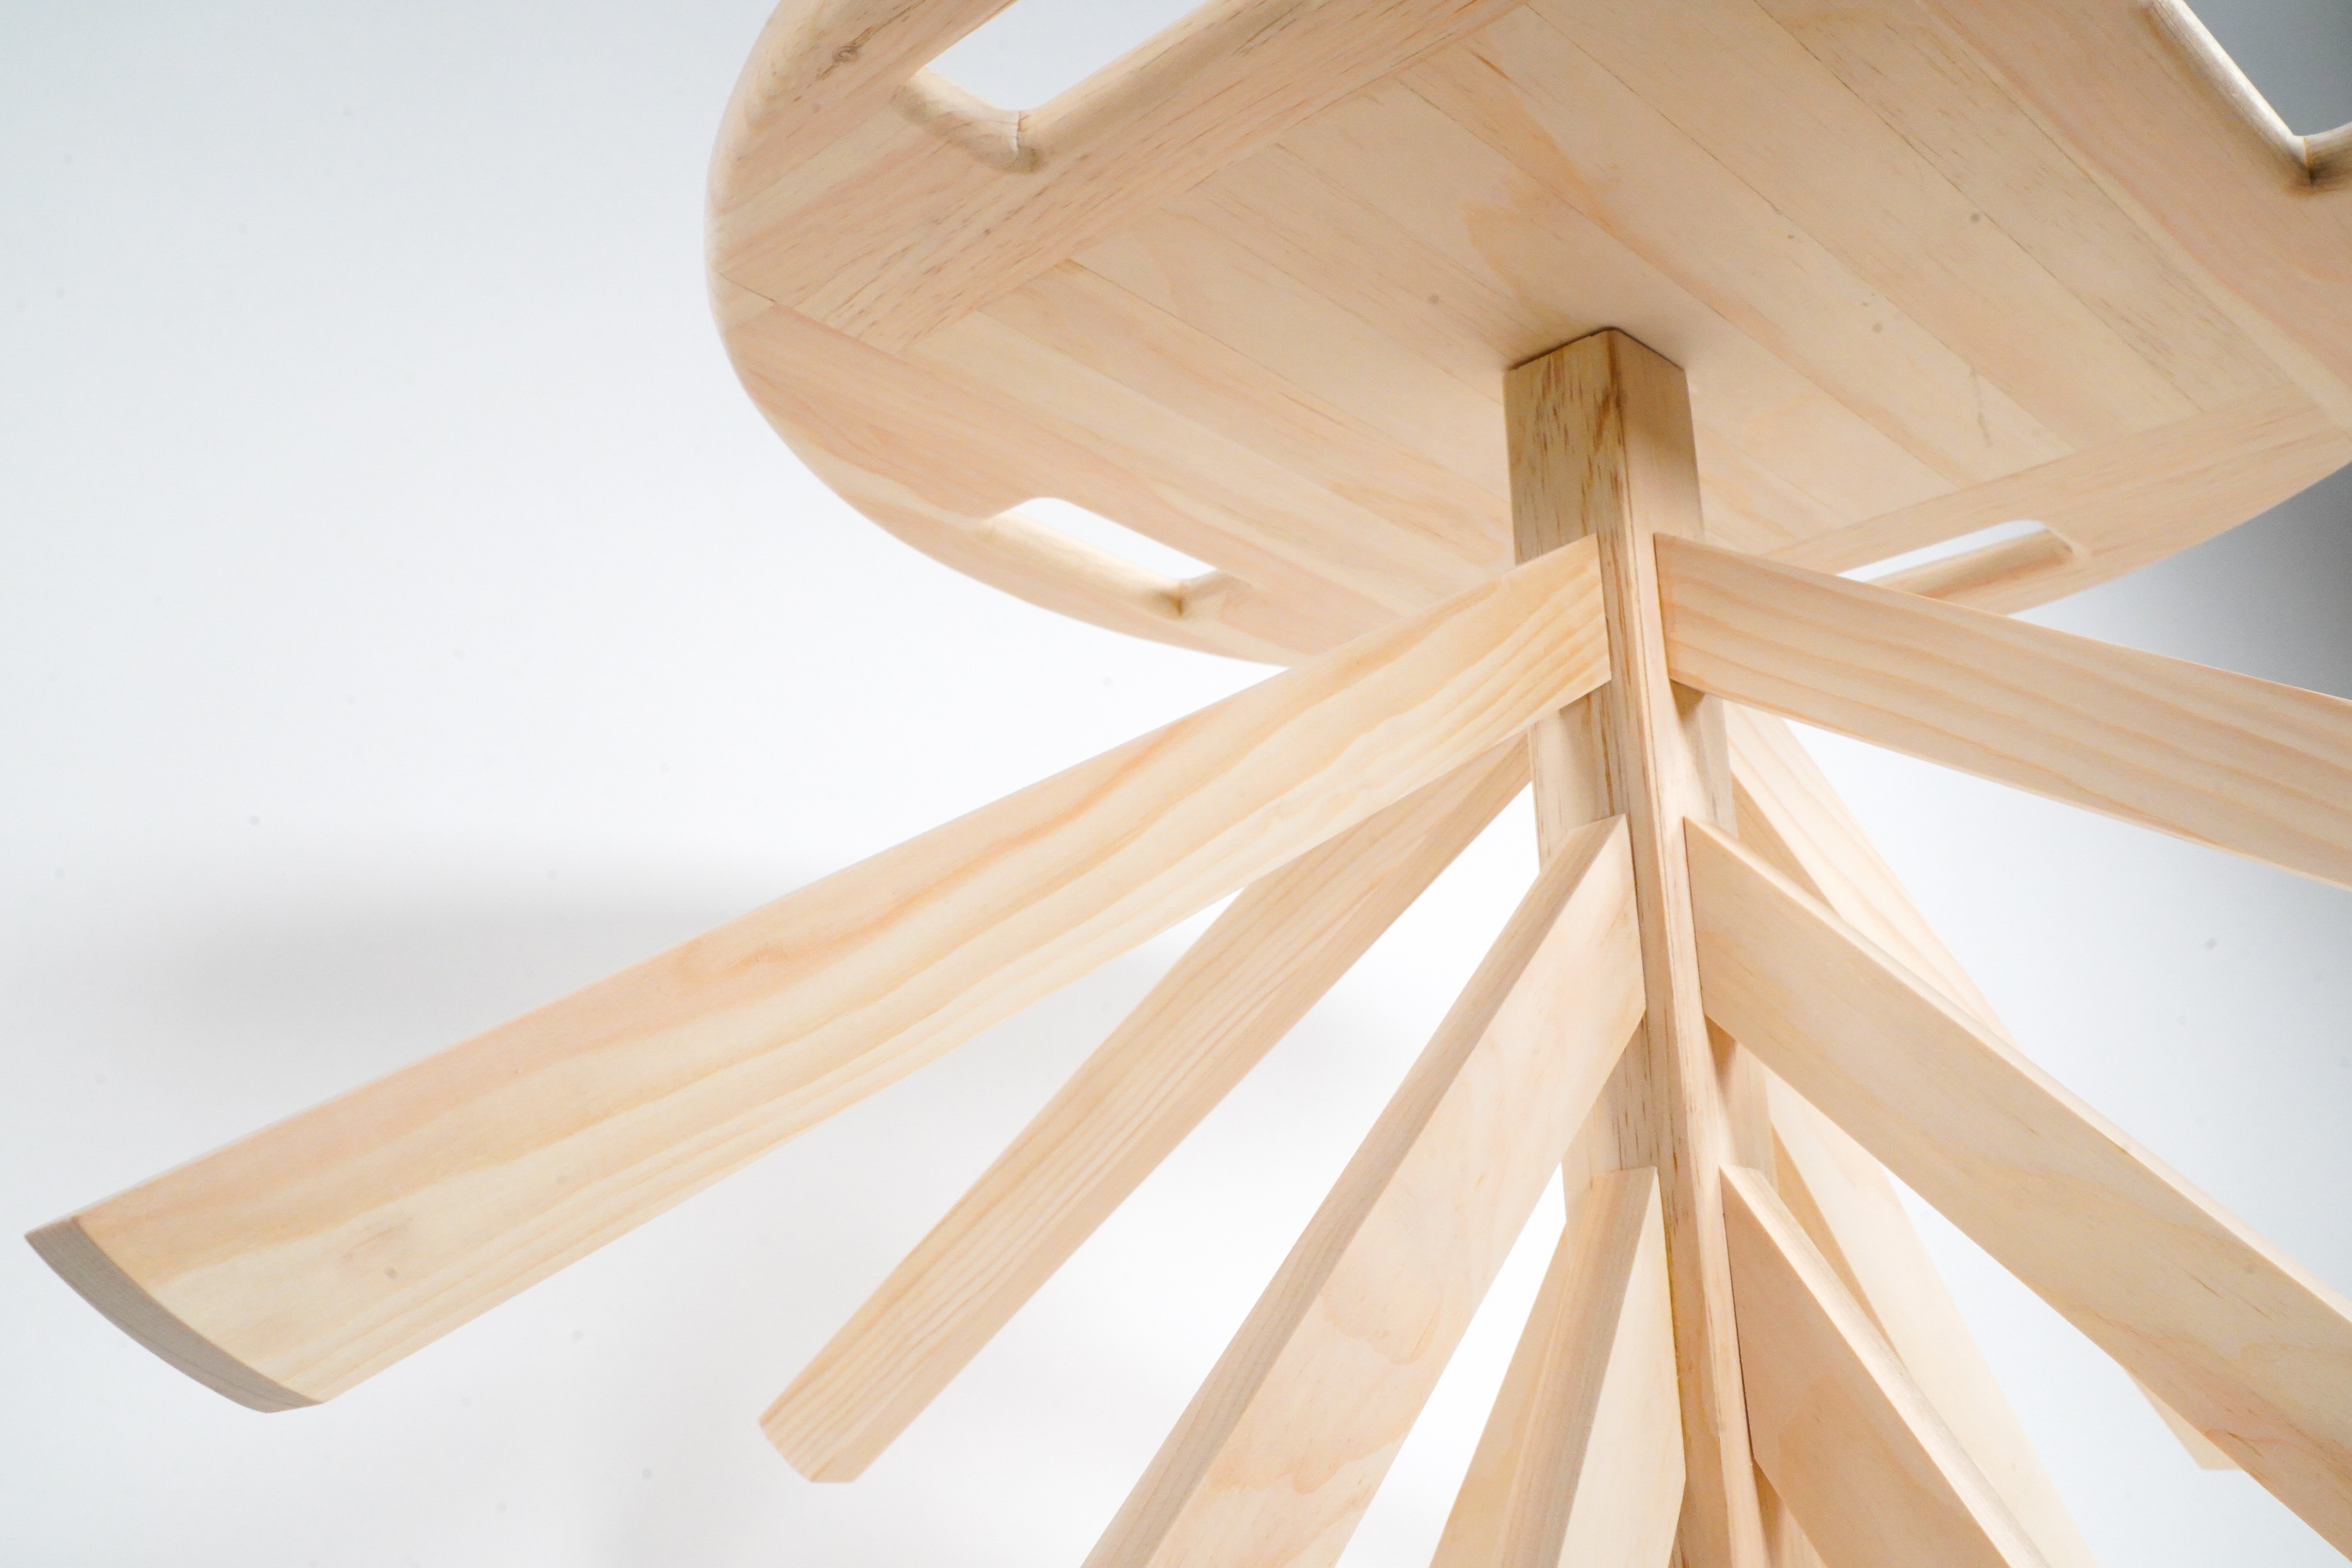
Playful chair design exploring aesthetics versus functionality. Project for 4.031 Objects and Interaction.
Hobby project, acrylic paints on jeans.