Process
This page details the process of creating Cabintine from the intial data processing through the fabrication and building of the acutal project.
Data Collection and Processing
The original dataset was written as journal entries in a physical notebook, starting with Day 1 on March 16th, when people first arrived at the cabin. Thus, the first step I took when starting this project was to photograph and digitize the data. I did not make an exact digital replica but focused instead on the elements I was most interested to explore in my project, including the mental states, people's descriptive words, day titles, and notable daily events. I began this process on Day 24 and started analyzing the data on Day 25, so I stopped digitizing the data after that point to avoid skewing future results. All members of the cabin consented to this data being used for my project, but for privacy reasons, I anonymized the data, labelling each person as a “Comrade” numbered 1-11. Comrades are only included in the log entry if they are physically present at the cabin that day, and thus there are no entries for a person before they arrive at the cabin. Initial exploration of the data was done in Tableau, and I became interested in exploring the individual and group trends of the mental states throughout the time in quarantine. Processing to compute the daily average mental states and overall average was also done in Tableau.
Fabrication Process
I first modeled the basic concept for a 3D bar chart of mental states in Rhinoceros with the people on one axis, the days on another, and the z axis encoding the value of the mental state.
Most physicalizations rely on modern fabrication techniques, like laser cutting and 3D printing. In the cabin, however, I did not have access to those tools, and thus, all elements of this project were constructed by hand from cereal and snack boxes. The materials used and quantities of each can be seen in the image below.
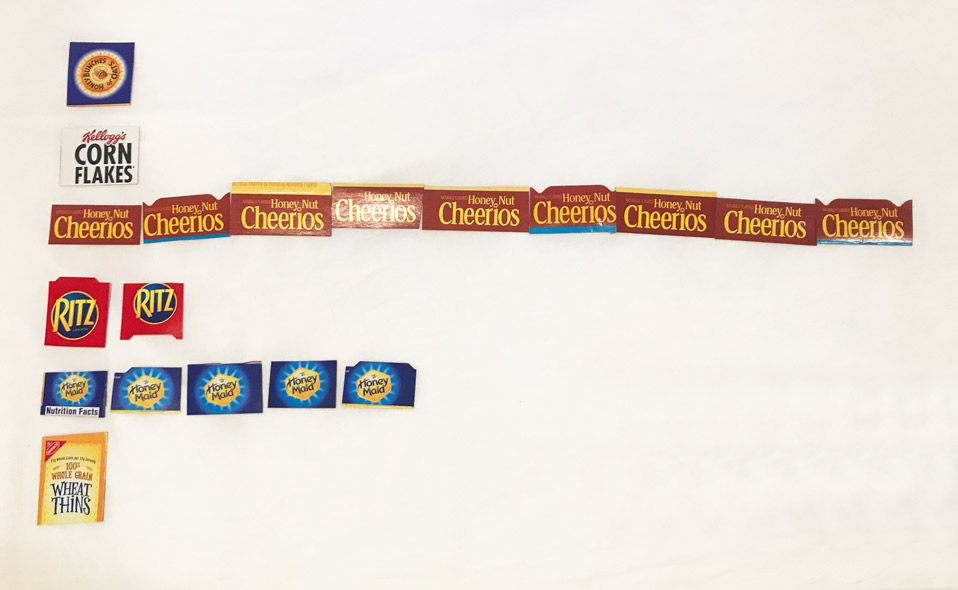
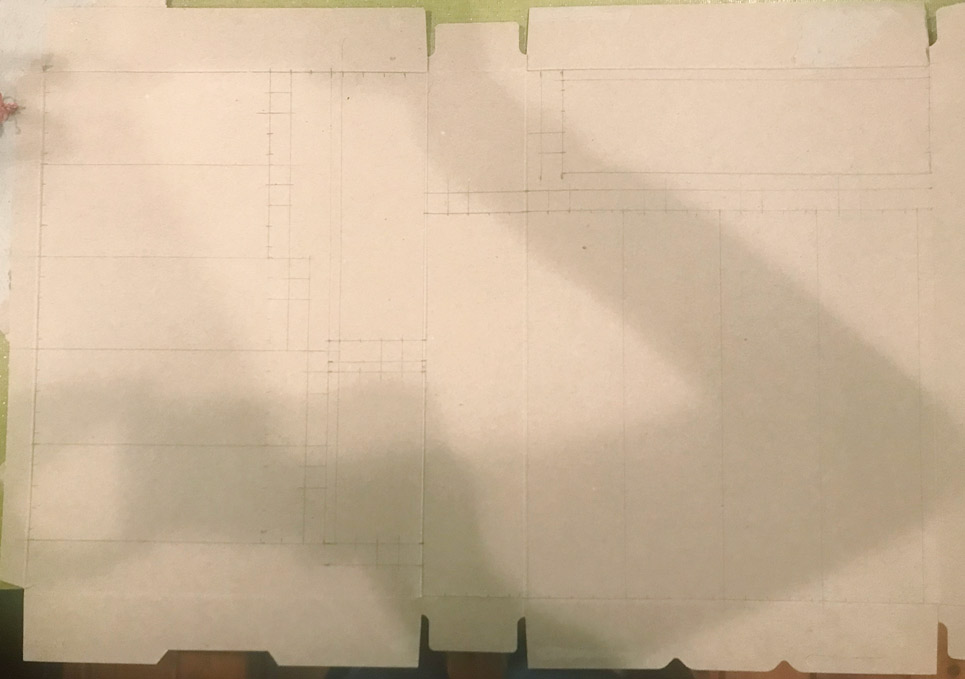
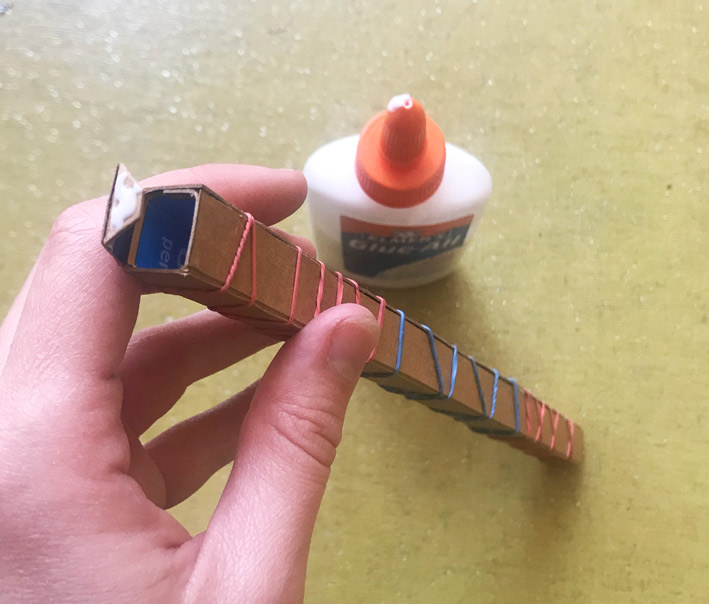
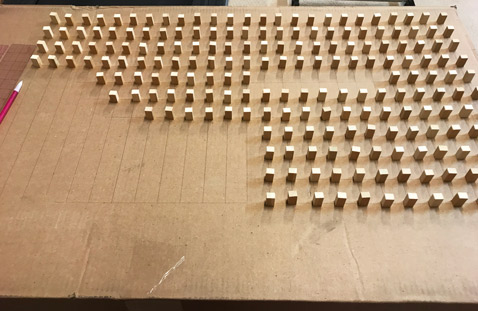
Each mental state was represented as a 0.5”x0.5”x(value of mental state)" sized bar that had to be measured, cut, scored, glued, and painted. The bars were constructed such that they were open and hollow on one end but closed on top. There were a total of 200 mental states logged in the first 25 days across the 11 cabin members, meaning this construction process was repeated 200 times. All bars were made from the materials pictured above, and I used a ruler, scissors, a craft knife, and Elmer's Glue for this process.
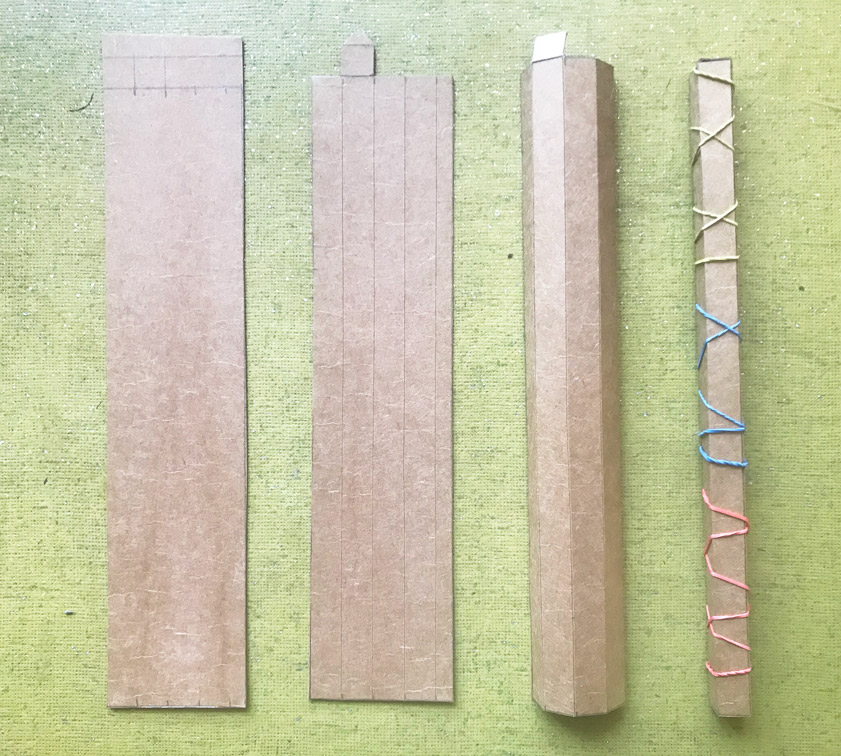
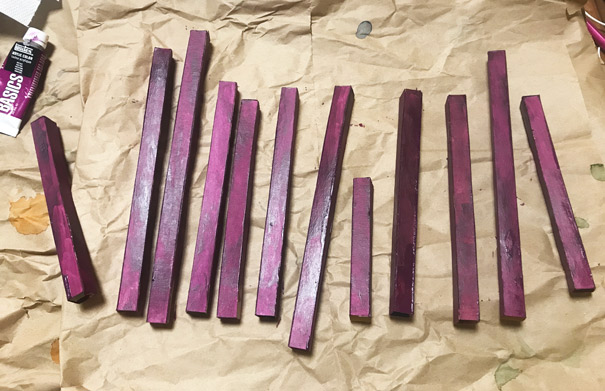
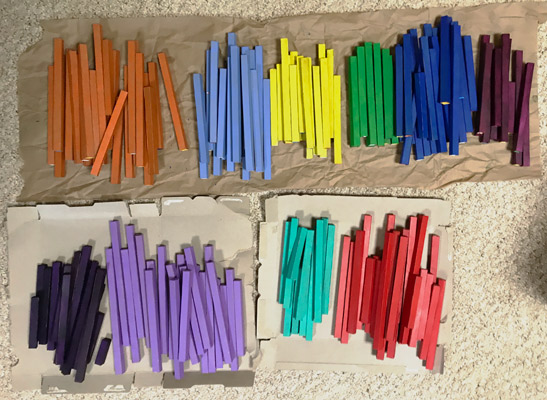
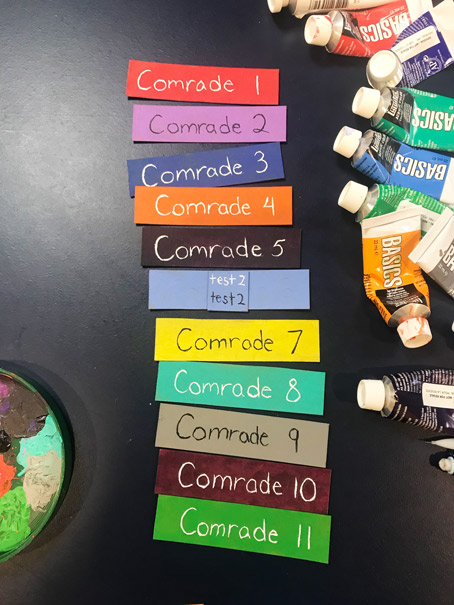
Eleven paint colors were chosen (one for each cabin member) from my set of 48 Basics acrylic paints such that there was sufficient differentiation between people. The bars were sorted by comrade and painted accordingly.
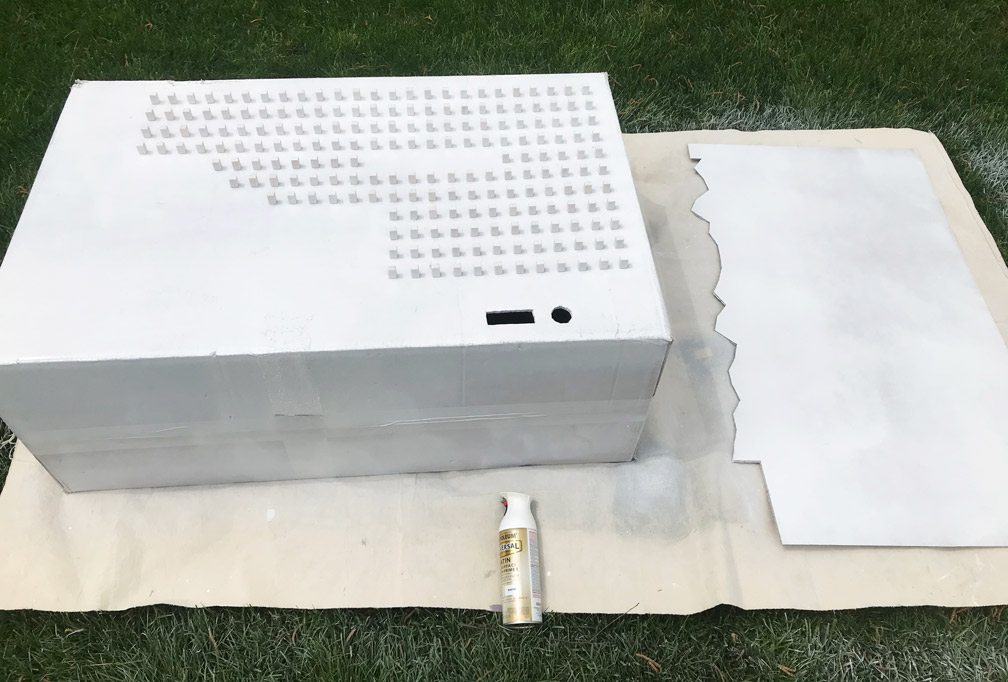
I was fortunate that another cabin member received numerous large shipments of materials for a class, and I used their cardboard boxes as the base and backboard of my piece. I left the base (an approximaly 40"x25"x15" double thickness cardboard box) mostly as is but cut the backboard piece of cardboard down to match the width and used the craft knife to cut the line chart into the top edge.
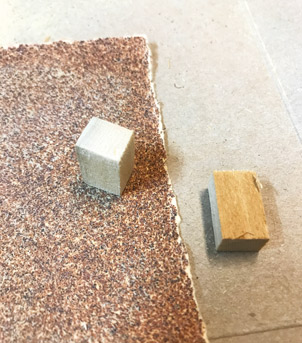
I wanted to make the bars of the chart removable, so I cut scraps of wood down to 1.5" high pegs with a length and width slightly smaller than the inside of the bars, allowing the bars to fit snugly when slid over the wood pieces. I was fortunate enough to be home at this point and had access to table and chop saws for this process. I next measured and gridded the top surface of the base and glued all 200 pegs into place. Then, the base, pegs, and backboard were spray painted white.
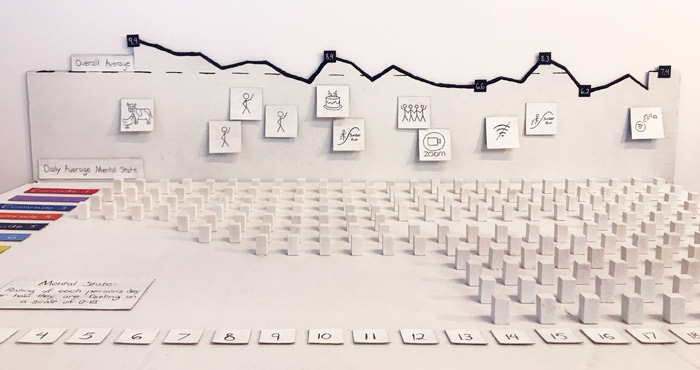
The next part of assembly involved painting all of the details, including black lines on the backboard for the daily and overall average mental state trends and all of the labels — comrades, days, numeric values on the line chart, the chart title, and a description of mental states. Finally, I made little icons along the backboard as a timeline of some fun events.
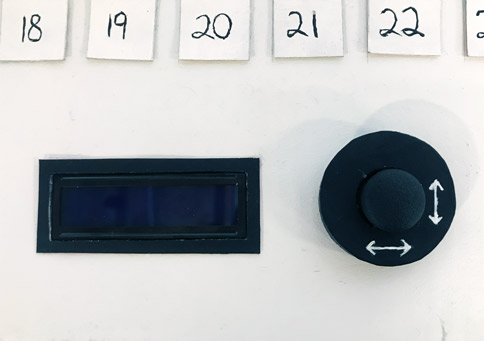
The final piece of the project was the electronic components. I had a spare Arduino, joystick, and a liquid crystal display (LCD) from other classes or previous kits, and I used these pieces to explore more of the textual data. I coded the Ardunio with a large matrix of strings for each person's daily word and the day titles. For days without entries for a comrade, I put "Arrives on day X" to indicate when they came to the cabin. The joystick, which can register movement in the x and y axises, is used to click through this digital matrix, which lines up with the physical bar matrix of mental states such that each bar has a corresponding word associated with it. The text then displays on the LCD.